Evals
The dashboard
The report is a JSON-driven SPA, not generated HTML — the
harness only ever writes scorecard.json (atomically, live-updated
during a run). A run opens it deep-linked at the current run so you
watch the scorecard fill in live; serve re-opens the same
dashboard to browse every past run.
lastlight-evals serve             # opens the dashboard over ./eval-results
lastlight-evals serve --port 4319 # preferred port (default 4319)
lastlight-evals serve --no-open   # start the server but don't open a browser
Two views
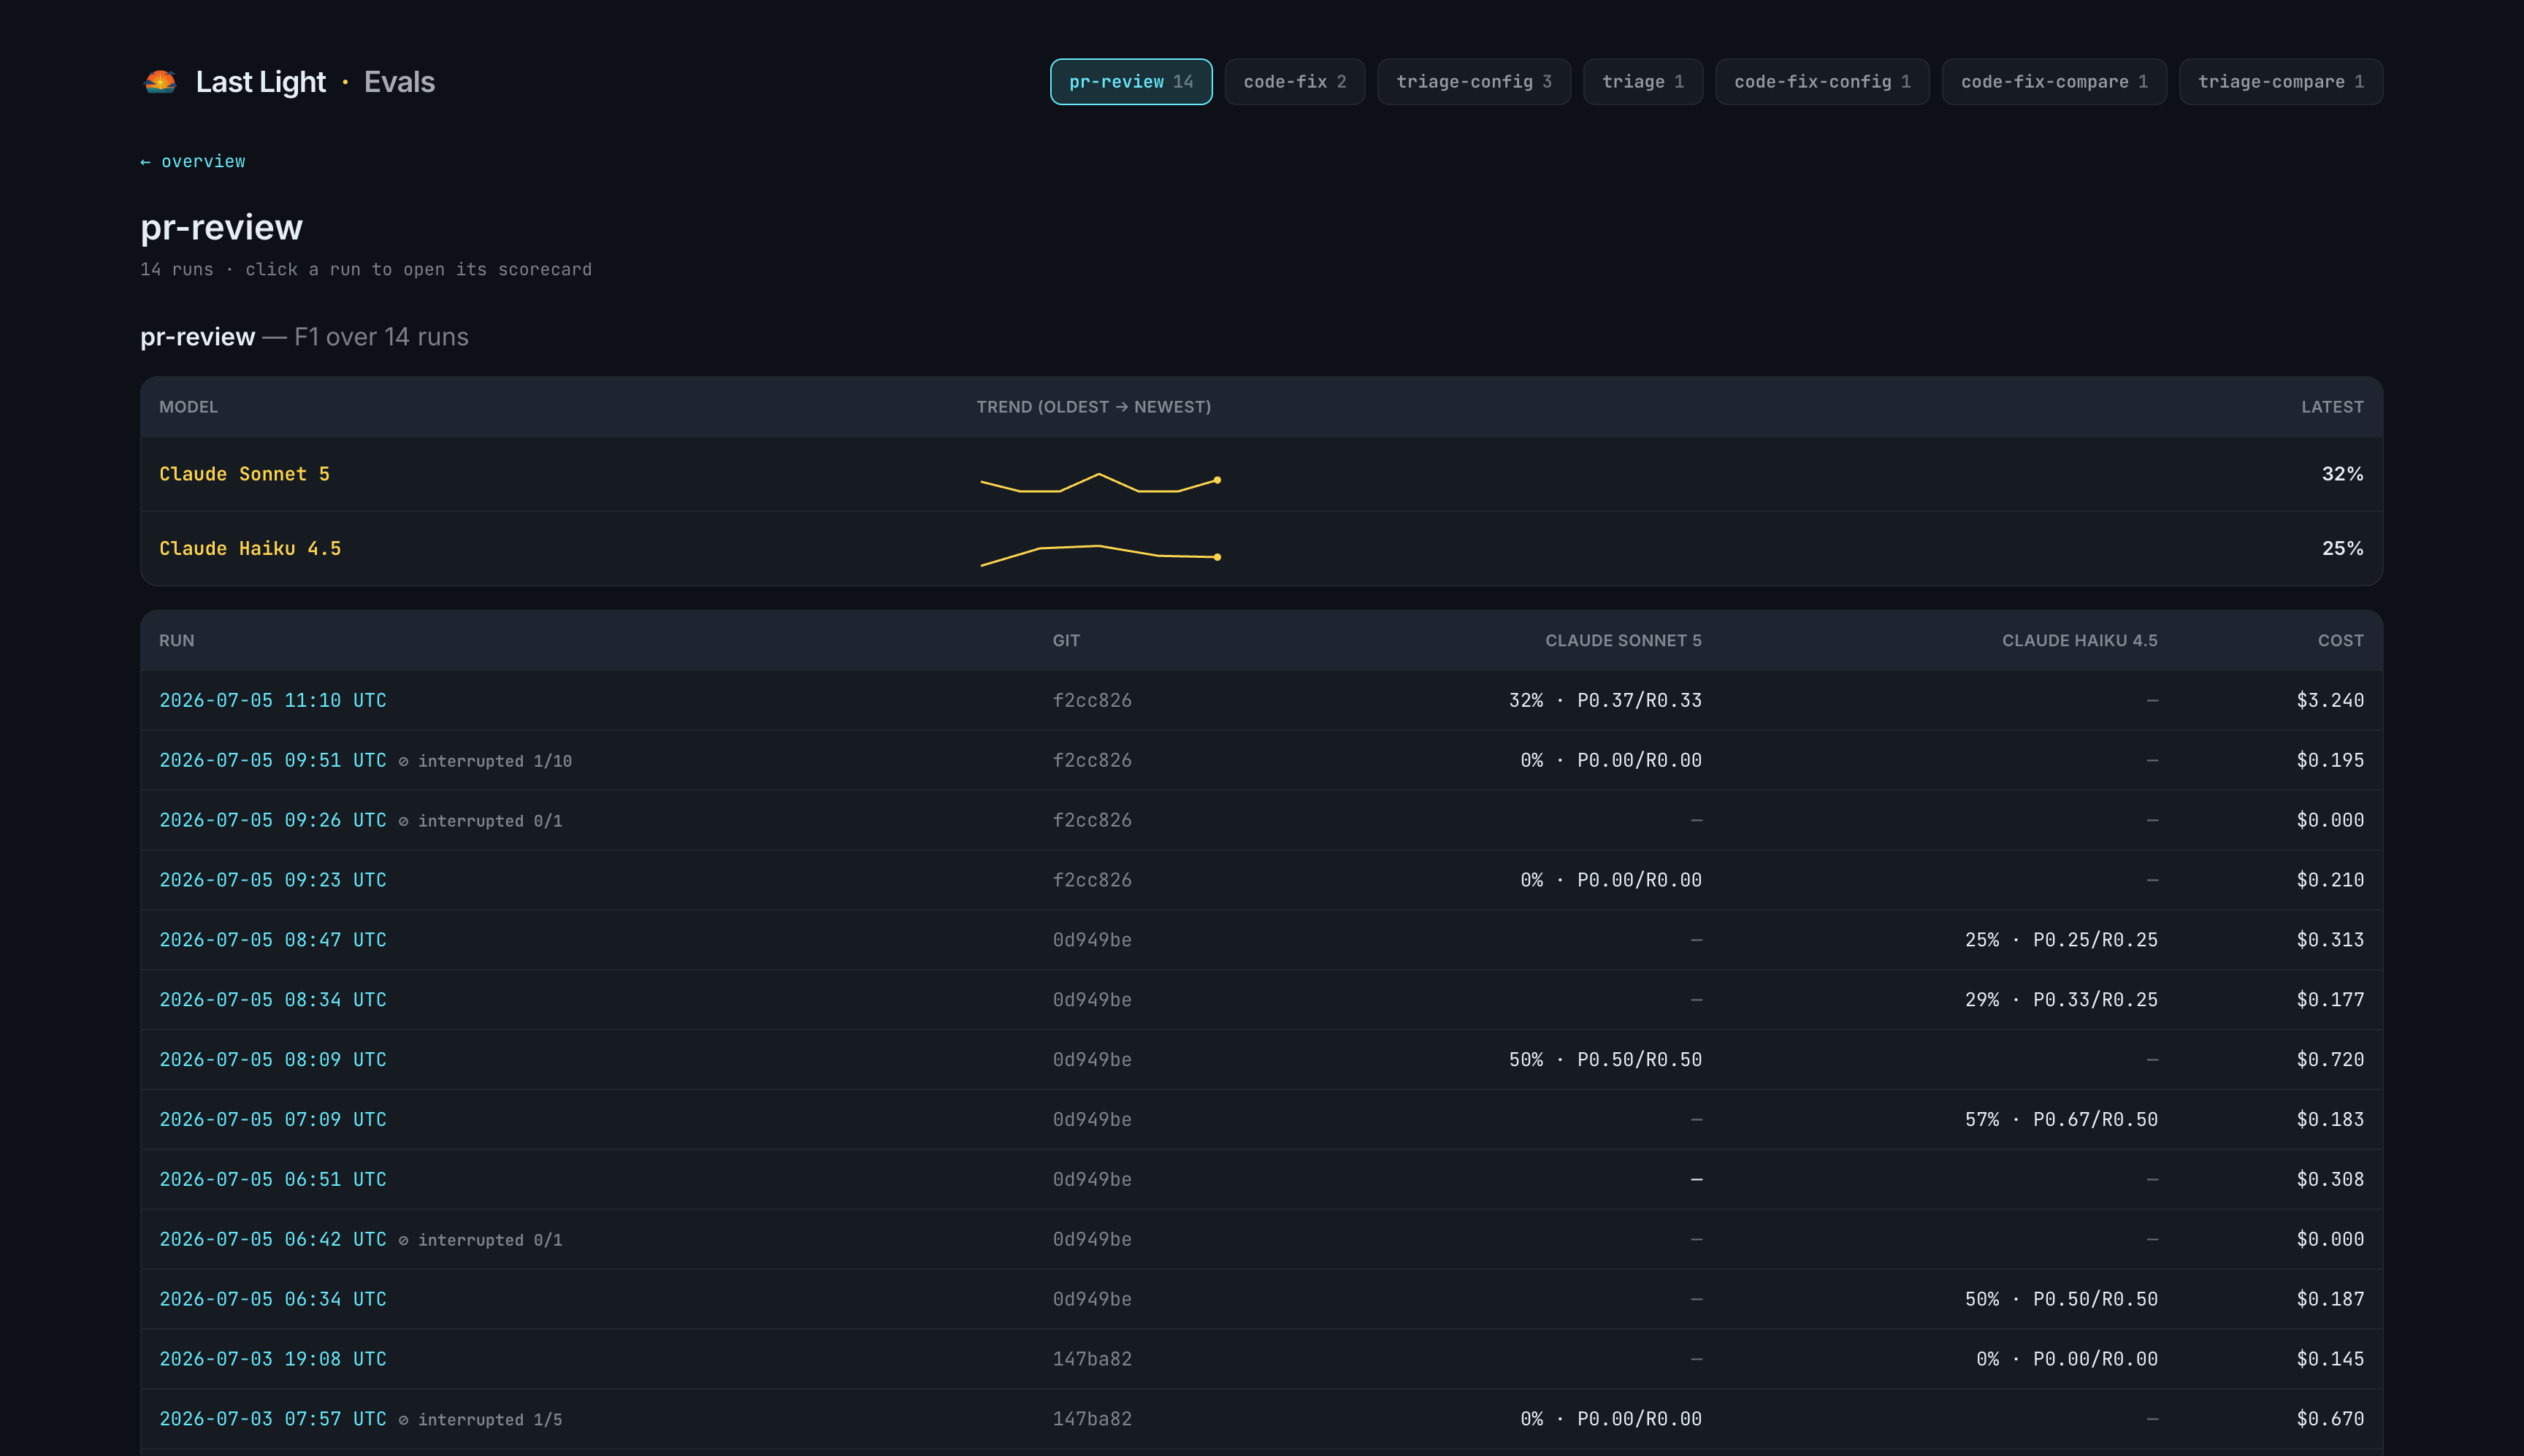
The overview lists every run newest-first, with a per-model trend sparkline per tier and a link into each run's full scorecard. Click a tier to see its history — the trend of each model over every run:
The run view is the model-comparison table (pass/score rate, cost, latency, tokens) plus per-instance rows. Each row carries buttons that make a score inspectable, not a number to trust:
| Button | Shows |
|---|---|
files | (code-fix) the agent's captured diff. |
log | The per-phase agent session log. |
tests | (code-fix) the captured setup log + TAP, for resolved and unresolved cases alike. |
judge | (pr-review) the judge trace — extracted findings ↔ gold, false positives, raw replies. |
A --mode config run also shows a Per-step models
panel with each workflow phase's resolved model.
Commit your results — and publish the dashboard
Everything the dashboard renders lives in your workspace, under
./eval-results/, as plain self-contained JSON — one folder per run,
accumulating instead of overwriting. That has two useful consequences:
- Commit them to git. Check
eval-results/into your evals repo and every run becomes part of the history — the overview's per-model trend sparklines and each tier's trend line then track quality over time, across commits and model changes, not just for one run. - Publish it as a static site. The dashboard is a prebuilt SPA over static JSON — no server logic beyond a filesystem read — so a results directory plus the SPA can be hosted on any static host (Cloudflare Pages, GitHub Pages, …) to share the whole history with your team.
eval-results/
served as a static site.
Finalize interrupted runs
A run killed or crashed mid-flight stays stuck showing "running" because the
scorecard never got its final write. clean finalizes those:
lastlight-evals clean --dry-run   # list killed/crashed runs stuck "running"
lastlight-evals clean             # finalize (mark interrupted; keeps partial scorecard + transcripts)
lastlight-evals clean --delete    # remove the run dir instead
# --older-than to scope by agescorecard.json
is self-contained — copy a run folder anywhere and serve renders
it.